|
 |
|
| Jim Worthey • Lighting & Color Research • jim@jimworthey.com • 301-977-3551 • 11 Rye Court, Gaithersburg, MD 20878-1901, USA |
|
|||||||
|
|
||||
|
| 3
Main Ideas |
 |
 |
 |
|
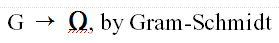
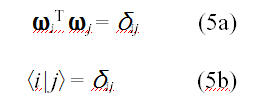
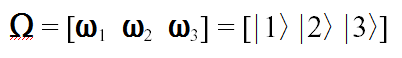
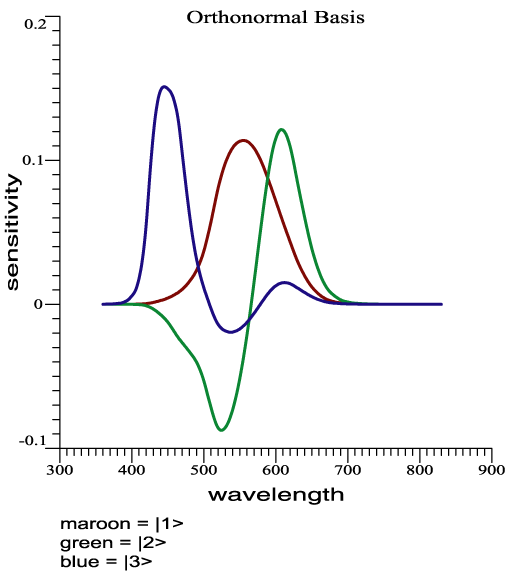
Orthonormal Color Matching Functions.
|
Vectorial Sensitivity to narrow-band lights. |
Tristimulus vectors,
including amplitude. |
| Early
Color-Matching Data of Guild or Wright. |
| Thoughts on Matching Data |
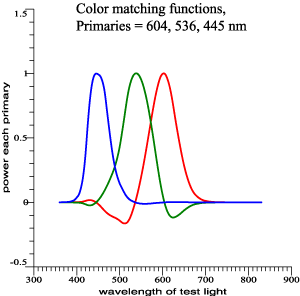
The
primary lights are not unique, and the same facts can be presented in
alternate sets of graphs, an awkward situation. However,
|
| Same Color Matches, Varying Overlap among Functions: |
 |
 |
 |
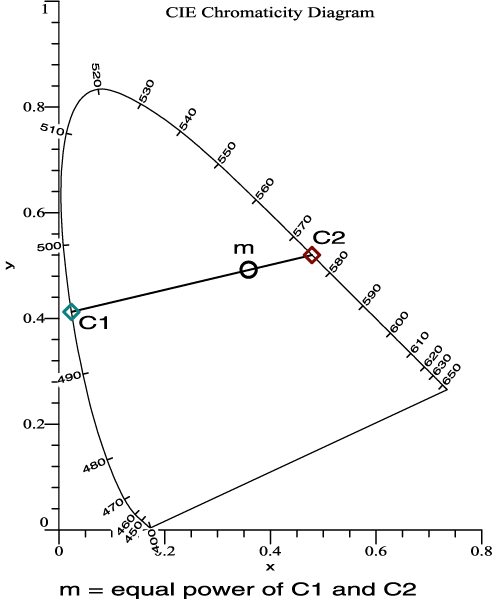
| (x, y) Diagram |
| So, we think in terms of the chromaticity diagram... | 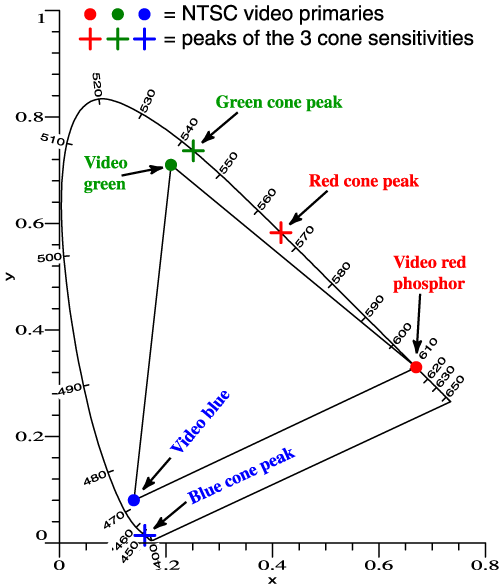 |
but those primary
colors are still needed.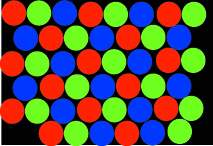 |
| Which Wavelengths Act Most Strongly in Mixtures? |
| MacAdam, and later
Thornton did calculations like this. Narrow-band lights of constant power are mixed with equal energy light. Some wavelengths perturb the white chromaticity more than others. Thornton coined the term "Prime Colors" for the 3 wavelengths that act most strongly. |
| Color
Matching
Functions Are in Fact Relatively Stable When the Primary Wavelengths Are Changed. |
|
Later
Thornton found:
Michael
Brill's new theorem:
When one primary
wavelength is changed (say the red
wavelength only) then the associated (red) color matching function
changes only in scale, not in shape.(For a more leisurely discussion of shifting primary wavelengths, please click here.) |
| Prime
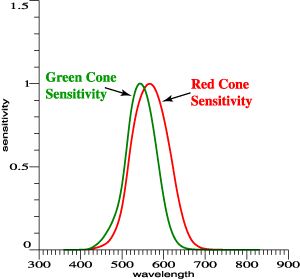
Colors Must Relate to the Overlap of Red and Green Sensitivities... |
 |
 |
 |
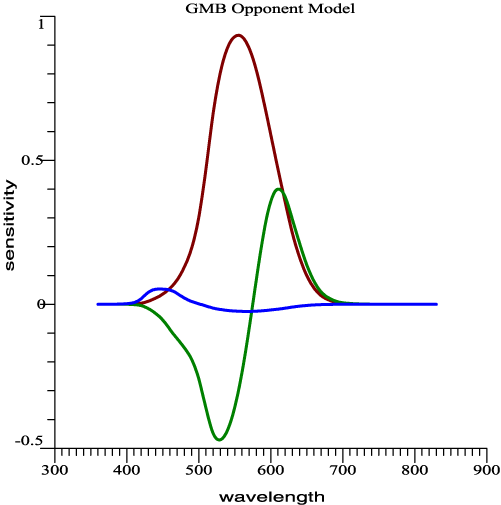
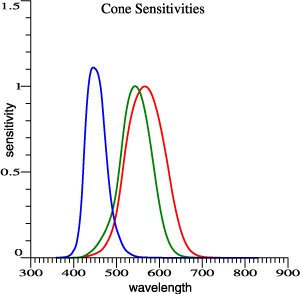
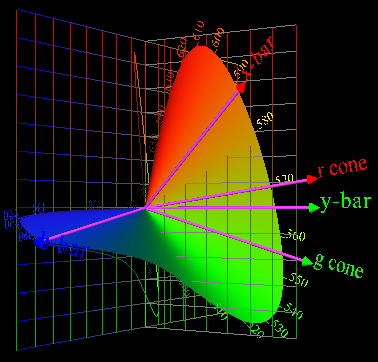
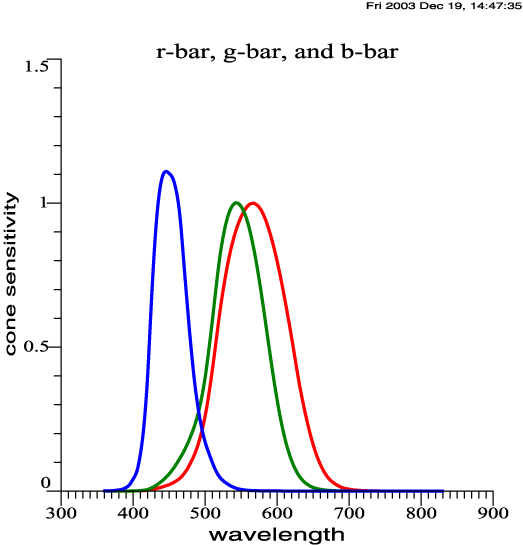
| Red and green cone functions are highly
overlapping. |
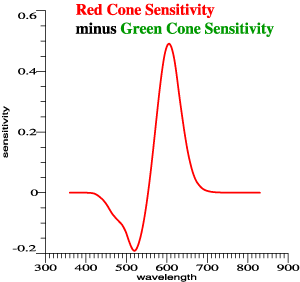
Subtracting green
from red gives peaks to account for Prime Colors, but the scaling is
arbitrary. |
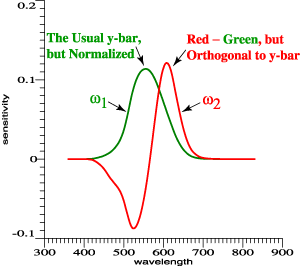
Achromatic
sensitivity, y-bar, is a linear combination of red and green. Find a
second combination that is orthogonal to it. |
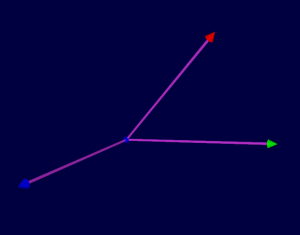
| One
Degree of Freedom Remains, to Re-mix ω1 and ω2, But Keep the Mixtures Orthogonal. |
| |
We start with ω1 and ω2,
which are
linear combinations of red and green cone functions, and are
orthonormal. Other orthonormal pairs of functions can be generated by a
rotation matrix: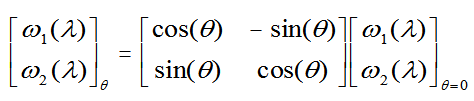 |
| Now
Make a Parametric Plot of ω2 vs ω1. Bingo, the Shape is Invariant. |
| Vectorial
Sensitivity to
Wavelength. |
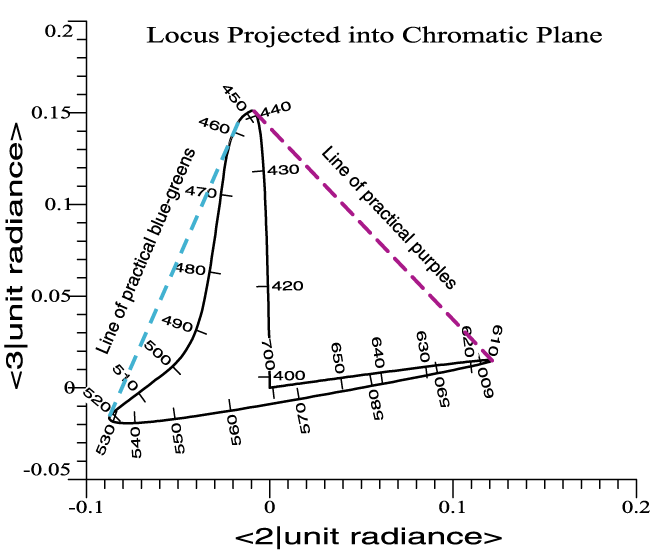
| For each λ, the
eye's sensitivity is a vector, (ω2, ω1) . The spectrum locus is the eye's vectorial sensitivity to color. It is not a boundary. The spectrum locus is alternatively the vectorial color of narrow-band lights, at unit power. |
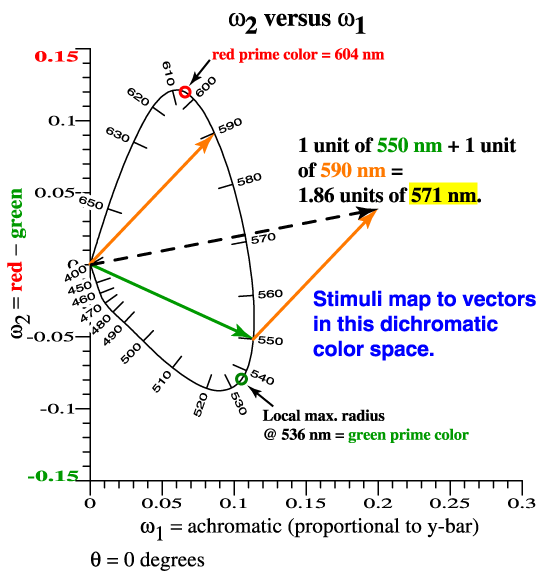 |
Prime colors are the wavelengths where radius is a local maximum! |
| Stalking
Prime Colors in the 2 Dimensions of Red and Green. |
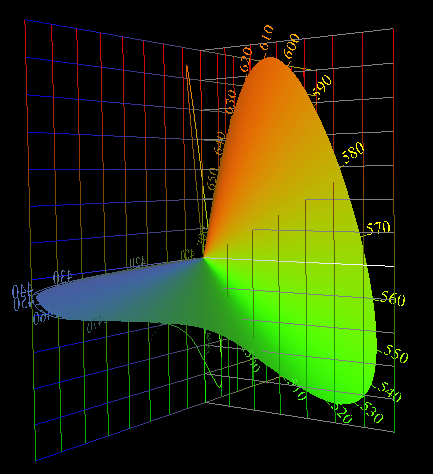
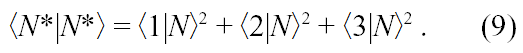
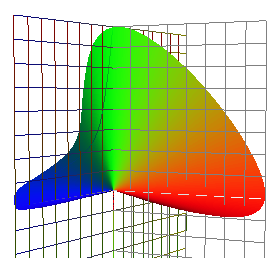
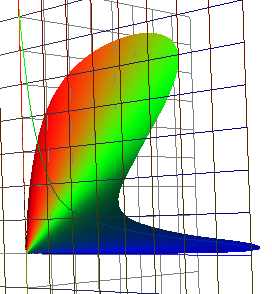
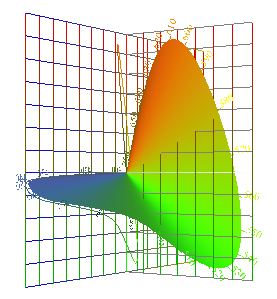
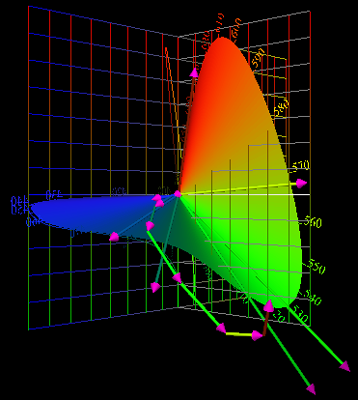
| Vectorial
Sensitivity to
Wavelength, Now in 3 Dimensions. |
 |
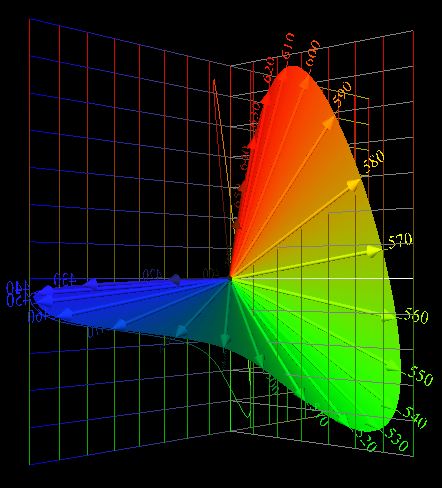 |
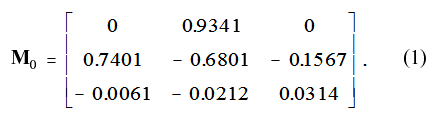
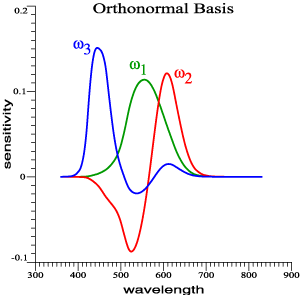
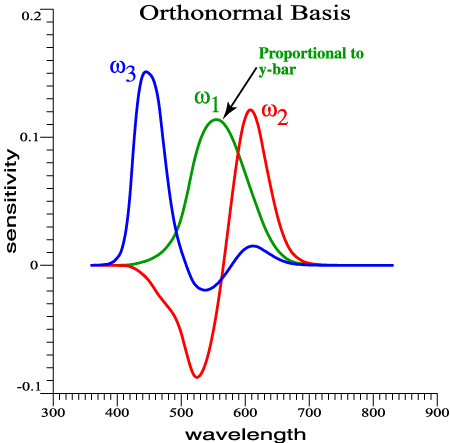
| Now
include the blue cones to create a set of 3 orthonormal color matching
functions. |
Combining the orthonormal functions
into a parametric plot yields Jozef Cohen's "Locus of Unit
Monochromats," the eye's Vectorial Sensitivity to Wavelength. |
| Features
of the Orthonormal System |
| Applications |
 |
 |
|
Multi-Primary
Imaging
|
Comparing Color Matching Functions
|
| Color
Rendering by Light Sources |
 |
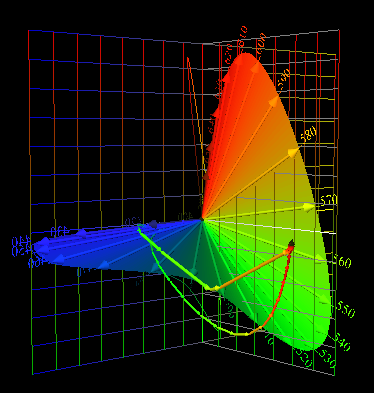 |
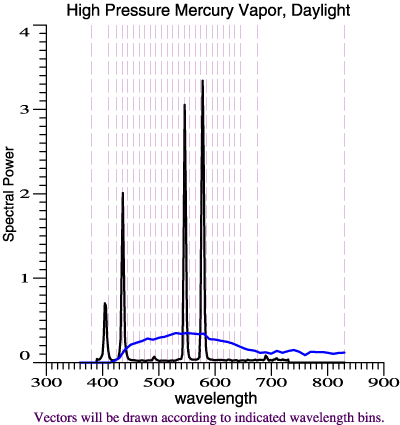
| A daylight phase has the same
tristimulus vector as a certain high-pressure mercury vapor light. [Sloppy calculation alert: The "daylight" is really outside the domain for the Judd, MacAdam, Wyszecki calculation.] |
Color Rendering
|
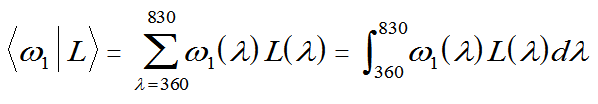
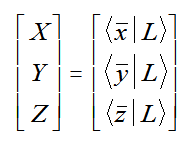
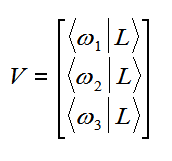
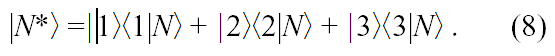
| Oh,
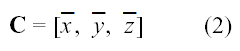
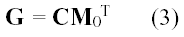
Yes, Calculating Tristimulus Vectors. |
Let L be a light, that is a Spectral
Power Distribution.
The calculation
is essentially the same, but the benefits of the orthonormal color
matching functions are tremendous!
|
| Issues
Demystified: |
| Special
Credit |
|
William A. Thornton Michael H.
Brill (But
MacAdam gets a demerit for disparaging Cohen's work.) Calculations were
done with O-matrix software. |
William A. Thornton
|
 Jozef B. Cohen
|
| Background |
| General
Background, including Thornton's
and Cohen's work is in Render Asking: James A. Worthey, "Color rendering: asking the question," Color Research and Application 28(6):403-412, December 2003. Mathematical detail is in Render Calc: James A. Worthey, "Color rendering: a calculation that estimates colorimetric shifts," Color Research and Application 29(1):43-56, February 2004. See http://www.jimworthey.com !
|
| Seldom
Asked Questions (links) |
| Stop |
| Scroll
No Farther |
 |
Material Below Addresses Obscure Questions |
| 2
colors, C1
and C2 are set to equal power. The mixture is m. |
| Cone
Sensitivities, Approximately Smith-Pokorny Primaries |
|
||
|
|
||
|
|
||
|
|
|
|
|
|||||||||||||
|
|||||||||||||
|
||||||
|
|
|
|
|
||
|
|